City trendsOctober 2026
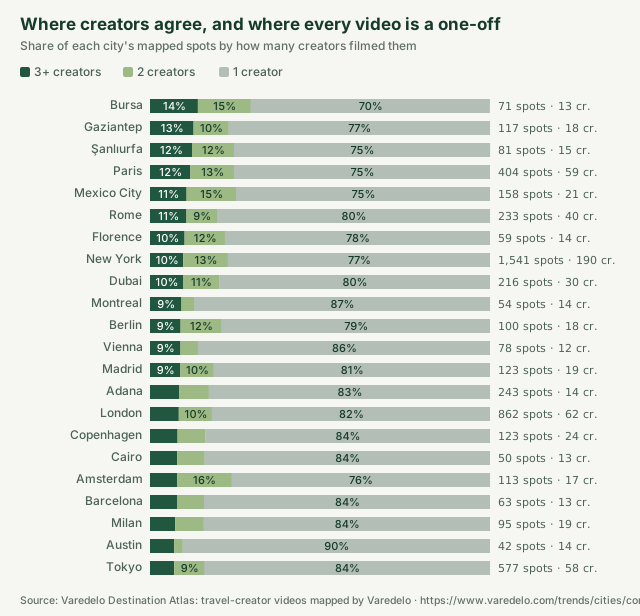
Where creators agree, and where every video is a one-off
Share of each city's mapped spots by how many creators filmed them
3+ creators2 creators1 creator
- Across 46 cities, 82% of the 9,903 spots creators film were filmed by one creator, and 7% by three or more.
- Agreement is highest in Bursa (14%) and lowest in Washington, D.C. (1%).
The numbers
| one | two | city | spots | creators | share one | three plus | share three plus | locked three plus |
|---|---|---|---|---|---|---|---|---|
| 50 | 11 | Bursa | 71 | 13 | 70% | 10 | 14% | 0 |
| 90 | 12 | Gaziantep | 117 | 18 | 77% | 15 | 13% | 4 |
| 61 | 10 | Şanlıurfa | 81 | 15 | 75% | 10 | 12% | 1 |
| 304 | 52 | Paris | 404 | 59 | 75% | 48 | 12% | 9 |
| 118 | 23 | Mexico City | 158 | 21 | 75% | 17 | 11% | 4 |
| 187 | 21 | Rome | 233 | 40 | 80% | 25 | 11% | 9 |
| 46 | 7 | Florence | 59 | 14 | 78% | 6 | 10% | 1 |
| 1188 | 202 | New York | 1541 | 190 | 77% | 151 | 10% | 16 |
| 172 | 23 | Dubai | 216 | 30 | 80% | 21 | 10% | 14 |
| 47 | 2 | Montreal | 54 | 14 | 87% | 5 | 9% | 1 |
| 79 | 12 | Berlin | 100 | 18 | 79% | 9 | 9% | 3 |
| 67 | 4 | Vienna | 78 | 12 | 86% | 7 | 9% | 4 |
| 100 | 12 | Madrid | 123 | 19 | 81% | 11 | 9% | 4 |
| 201 | 21 | Adana | 243 | 14 | 83% | 21 | 9% | 5 |
| 705 | 84 | London | 862 | 62 | 82% | 73 | 8% | 17 |
| 103 | 10 | Copenhagen | 123 | 24 | 84% | 10 | 8% | 2 |
| 42 | 4 | Cairo | 50 | 13 | 84% | 4 | 8% | 0 |
| 86 | 18 | Amsterdam | 113 | 17 | 76% | 9 | 8% | 3 |
| 53 | 5 | Barcelona | 63 | 13 | 84% | 5 | 8% | 0 |
| 80 | 8 | Milan | 95 | 19 | 84% | 7 | 7% | 2 |
| 38 | 1 | Austin | 42 | 14 | 90% | 3 | 7% | 0 |
| 485 | 51 | Tokyo | 577 | 58 | 84% | 41 | 7% | 11 |
| 103 | 10 | Antalya | 121 | 13 | 85% | 8 | 7% | 0 |
| 36 | 7 | New Orleans | 46 | 12 | 78% | 3 | 7% | 0 |
| 130 | 17 | Osaka | 157 | 22 | 83% | 10 | 6% | 4 |
| 88 | 16 | San Francisco | 111 | 23 | 79% | 7 | 6% | 2 |
| 1072 | 162 | Istanbul | 1310 | 72 | 82% | 76 | 6% | 6 |
| 117 | 16 | İzmir | 141 | 25 | 83% | 8 | 6% | 0 |
| 299 | 41 | Philadelphia | 360 | 33 | 83% | 20 | 6% | 4 |
| 82 | 7 | Hong Kong | 94 | 12 | 87% | 5 | 5% | 2 |
| 162 | 9 | Singapore | 180 | 24 | 90% | 9 | 5% | 2 |
| 70 | 8 | Seattle | 82 | 14 | 85% | 4 | 5% | 3 |
| 191 | 8 | Bangkok | 209 | 16 | 91% | 10 | 5% | 3 |
| 135 | 12 | Kyoto | 154 | 21 | 88% | 7 | 5% | 4 |
| 129 | 14 | Seoul | 149 | 17 | 87% | 6 | 4% | 1 |
| 356 | 33 | Los Angeles | 405 | 33 | 88% | 16 | 4% | 0 |
| 112 | 13 | Miami | 129 | 21 | 87% | 4 | 3% | 0 |
| 52 | 14 | Delhi | 68 | 12 | 76% | 2 | 3% | 1 |
| 127 | 23 | Ankara | 154 | 15 | 82% | 4 | 3% | 2 |
| 37 | 4 | Naples | 42 | 12 | 88% | 1 | 2% | 0 |
| 85 | 6 | Hanoi | 93 | 12 | 91% | 2 | 2% | 1 |
| 96 | 6 | Toronto | 104 | 18 | 92% | 2 | 2% | 0 |
| 101 | 7 | Chicago | 110 | 21 | 92% | 2 | 2% | 0 |
| 80 | 9 | Las Vegas | 90 | 19 | 89% | 1 | 1% | 0 |
| 88 | 5 | Sydney | 94 | 12 | 94% | 1 | 1% | 1 |
| 91 | 5 | Washington, D.C. | 97 | 12 | 94% | 1 | 1% | 0 |
From the places in travel-creator videos that Varedelo maps, assigned to a city by distance from its centre; cities with 8 creators or more. Counts are creators or spots, never videos. Opening hours and price levels are Google’s. Data as of 2026-10-30.